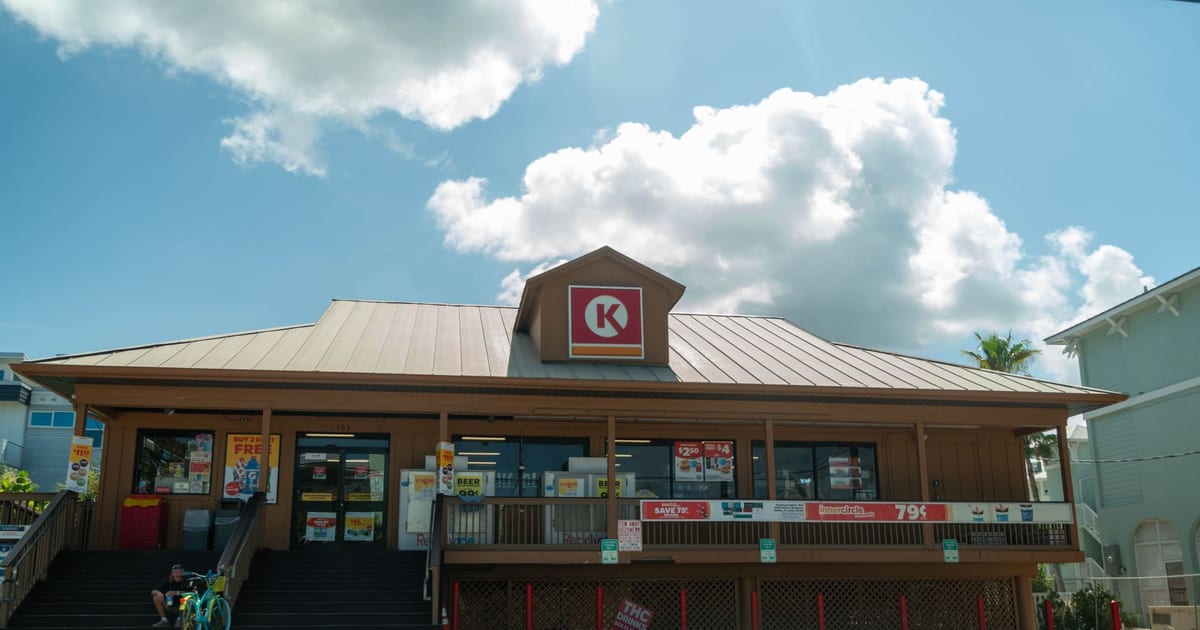
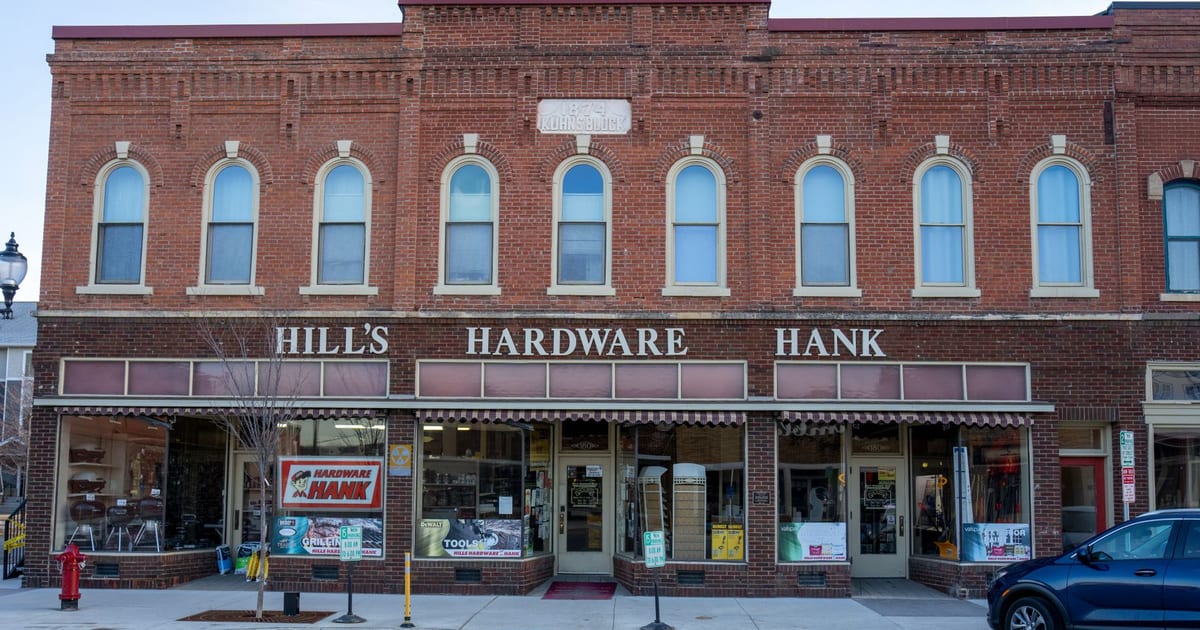
What is a net lease cap rate? A net lease cap rate is a property's annual net operating income divided by its purchase price, expressed as a percentage, and it is the single number net lease buyers use to compare one single-tenant deal against another. A 5.5% cap rate and an 8% cap rate on otherwise similar buildings are not two different flavors of the same deal. They are the market pricing two different sets of risk, and triple net lease investing only makes sense once that spread is read correctly.
Key Takeaways
- A cap rate is net operating income divided by purchase price, so a 5.5% cap rate price for a given rent is a higher price than an 8% cap rate price for the same rent.
- Tenant credit quality is usually the largest single driver of the spread between a 5.5% deal and an 8% deal carrying similar rent and similar remaining lease term.
- Boulder Group's Q2 2026 national net lease data put overall single-tenant cap rates at 6.82%, with industrial averaging higher than retail and office averaging highest of the three.
- Remaining lease term shortens the span of income a buyer can count on with confidence, so two otherwise similar buildings rarely share a cap rate once their lease terms diverge.
- The gap between a property's cap rate and the 10-year Treasury yield is the market's price for every layer of risk sitting on top of a government bond.
- A cap rate by itself says nothing about whether a deal is priced well; it only means something once it is read against the tenant, the lease, and the property type behind it.
| Implied property value (hypothetical $500,000 NOI) | |
|---|---|
| 5.5% | $9.1M |
| 6.5% | $7.7M |
| 7.5% | $6.7M |
| 8.0% | $6.3M |
Illustrative arithmetic to show the mechanism, not market data.
What Is a Net Lease Cap Rate, and How Is It Calculated?
A net lease cap rate is calculated by dividing a property's net operating income by its purchase price. A building producing $100,000 a year in rent, with no landlord expenses left to subtract under a true net lease, priced at $1,818,182 is trading at a 5.5% cap rate. The same $100,000 of income priced at $1,250,000 is trading at an 8% cap rate.
The formula is simple; the inputs rarely are. Net operating income in a true net lease deal is close to gross rent, because the tenant is paying property taxes, insurance, and maintenance directly, a structure covered in the guide to who pays taxes, insurance, and maintenance under a net lease. In a lease where some of those costs stay with the landlord, net operating income is smaller than the headline rent, and a cap rate calculated against the wrong number is not comparable to one calculated correctly.
Price moves inversely with the cap rate for a fixed stream of income. A lower cap rate means a buyer is paying more for every dollar of annual rent, and an investor comparing two deals has to ask why one dollar of rent commands a higher price than the other. The answer is almost never the building. It is almost always the tenant, the lease, and the property type standing behind that dollar.
Why Tenant Credit Quality Drives Most of the Spread
Tenant credit quality is usually the single largest reason a 5.5% deal and an 8% deal can sit on buildings that look nearly identical from the street. A lease is only worth what the signer can pay, and the market prices that ability directly into the cap rate.
Rating agencies draw a specific line for this. S&P Global Ratings treats BBB- and above as investment grade, and Moody's uses Baa3 as the equivalent cutoff. A lease backed by an investment-grade corporate guaranty is treated by the market as close to a bond coupon, and it prices accordingly, often at the lower end of the cap rate range. A lease backed by a franchisee, a single-purpose entity, or an unrated operator carries real default risk that a rating simply has not measured, and buyers demand a higher cap rate to accept it.
How to actually verify which entity signed the lease, and how strong that entity's balance sheet really is, is the subject of the guide to how to evaluate a net lease tenant's credit. The short version for cap rate purposes is that the same brand on the sign can sit behind two very different obligors, and only one of those obligors deserves the lower cap rate the brand name tends to suggest. A buyer who prices a franchisee-backed lease as though a public parent guaranteed it is paying an investment-grade cap rate for a sub-investment-grade risk, and that gap is where a disappointing exit is usually born.
How Remaining Lease Term Changes the Math
Remaining lease term changes the math because a cap rate is really a statement about how many years of income a buyer can count on before the next negotiation. A lease with fifteen years left and a lease with three years left can sit on identical buildings with identical tenants and still price at very different cap rates, because the buyer of the second deal is pricing a renewal decision that is coming up fast.
A long remaining term lets a buyer underwrite a known income stream for most of a typical hold period, which supports a lower cap rate. A short remaining term means the buyer is effectively underwriting two things at once: the current rent for whatever years remain, and a renewal or re-leasing scenario that has not happened yet. That second, uncertain piece is what pushes cap rates higher as a lease approaches its expiration, even when the tenant has never missed a payment.
This is also why portfolios of single-tenant properties are frequently described by their weighted average lease term, a figure that weights each lease by its size so a handful of long-dated leases cannot disguise a cluster of near-term expirations sitting underneath them. A deal priced at an 8% cap rate with three years of term left is not automatically a worse investment than a 5.5% cap rate deal with fifteen years left. It is a different bet on what happens at the next renewal, priced as such.
Property Type and Location: Retail, Industrial, and Office Spreads
Property type sets a baseline spread before tenant credit or lease term ever enters the picture, because retail, industrial, and office net lease assets carry structurally different vacancy risk, re-leasing cost, and buyer pools. Boulder Group's Q2 2026 National Net Lease Report put overall single-tenant net lease cap rates at 6.82%, with retail averaging 6.60%, industrial averaging 7.25%, and office averaging 7.90%.
Retail's lower average reflects a deep, liquid pool of buyers for single-tenant retail boxes, many of them necessity-based tenants that have proven resilient through downturns. Industrial trades at a meaningful premium over retail in that same data, reflecting a smaller buyer pool for single-tenant industrial and, in many cases, a building with fewer alternative uses if the tenant leaves. Office sits highest of the three, reflecting both a smaller pool of willing buyers and a more uncertain re-leasing picture following the shift toward hybrid and remote work.
None of that means every retail deal underprices every industrial deal. A weak retail tenant on a short lease can easily trade at a higher cap rate than a strong industrial tenant on a long lease. Property type sets the starting range the market expects to see. Tenant credit and lease term then move a specific deal up or down within, or sometimes well outside, that range.
How a 10-Year Treasury Yield Sets the Floor
A 10-year Treasury yield, tracked by the U.S. Department of the Treasury's daily par yield curve, sets a floor under every net lease cap rate because net lease income competes directly with the return available from a government bond, and investors generally demand a spread over that bond yield to accept a tenant's credit, a building's illiquidity, and the work of ownership. When the Treasury yield rises, the floor rises with it, and cap rates tend to follow with a lag.
The mechanics of that transmission, including how a higher Treasury yield reaches commercial borrowing costs and why cap rates reprice more slowly than bond yields do, are covered in the guide to how a higher 10-year Treasury yield reaches commercial real estate. What matters for comparing a 5.5% deal and an 8% deal at the same point in time is that both are measured against the same Treasury benchmark on the same day. A 5.5% cap rate when the Treasury benchmark sits at one level is a very different risk premium than the identical 5.5% cap rate when that benchmark sits a full point higher, which is one reason comparing cap rates across different periods without checking the benchmark on each date is a common and avoidable mistake.
What a 5.5% Deal and an 8% Deal Are Actually Pricing
A 5.5% cap rate deal and an 8% cap rate deal are both answers to the identical question: how much risk sits between the rent check arriving today and the rent check arriving in year fifteen. The lower number says the market believes that risk is small. The higher number says the market believes it is considerably larger, whether because of the tenant, the remaining term, the property type, or some combination of all three.
Reading a single cap rate in isolation answers nothing. Reading it against the tenant's credit, the years left on the lease, the property type, and the Treasury benchmark on the day of pricing turns the same number into an actual description of what is being bought. A buyer who only compares headline cap rates across a stack of offering memoranda is comparing numbers that were never meant to be compared without that context attached.
Freedom Commercial Real Estate publishes these guides so investors can read a net lease cap rate the way an underwriter does before they ever look at a specific deal. Questions about anything covered here, or a net lease topic worth explaining next, can go straight to the team at info@freedomcre.net.
Frequently Asked Questions
Q: What is a good cap rate for a net lease property?
A: There is no single cap rate that is good across every net lease deal, because the right number depends on the tenant's credit quality, the remaining lease term, and the property type. A 7% cap rate on a short-term lease to an unrated operator can be priced appropriately for its risk, while the same 7% on a long-term lease to an investment-grade tenant could be unusually generous to the buyer.
Q: Why do two net lease properties with similar rent trade at different cap rates?
A: The rent is only one input into the price. Tenant credit quality, how many years remain on the lease, and whether the property is retail, industrial, or office all shape how much risk a buyer believes they are taking on for that rent, and the cap rate is the market's way of pricing that risk.
Q: Does a lower cap rate always mean a better investment?
A: No. A lower cap rate means a buyer paid more for each dollar of current income, which is usually justified by stronger tenant credit, a longer remaining lease term, or a more liquid property type. It says nothing on its own about whether the price was fair, and it says nothing about future performance, which is never guaranteed.
Q: How does the 10-year Treasury yield affect net lease cap rates?
A: Net lease income competes with the return available from a government bond, so a rising Treasury yield tends to push cap rates higher over time, though cap rates typically adjust more slowly than bond yields do. Comparing cap rates from different periods without checking the Treasury benchmark on each date can make a deal look mispriced when it was simply priced against a different benchmark.
Q: Are industrial and office net lease cap rates the same as retail?
A: No. Boulder Group's Q2 2026 data put overall single-tenant net lease cap rates at 6.82%, with retail averaging 6.60%, industrial averaging 7.25%, and office averaging 7.90%. These are sector averages rather than a rule for any individual deal, and a specific property's tenant credit and lease term can move it well above or below its sector's average.
Sources
- The Boulder Group, National Net Lease Research
- U.S. Department of the Treasury, Daily Treasury Par Yield Curve Rates
Have a question about what you just read? Freedom Commercial Real Estate publishes these guides as investor education. Send the team your question, or keep reading below.
Get The Freedom Brief in your inbox
On the 15th of each month: the three guides most worth your time, the month's series, a stewardship reflection, and one sourced number. Education only, never a sales pitch. Unsubscribe any time.
This article is for informational purposes only and is not an offer to sell or a solicitation of an offer to buy any security, nor investment, tax, or legal advice. Any offering is made only through official offering documents to verified accredited investors. Past performance does not guarantee future results.